Will the smoke clear before the weekend?
Check the four-day forecast at home or at your destination before changing your plans.
See the four-day forecastSee hourly AQI forecasts up to 4 days out, so you can plan when to head outside—and when to wait.
See how it works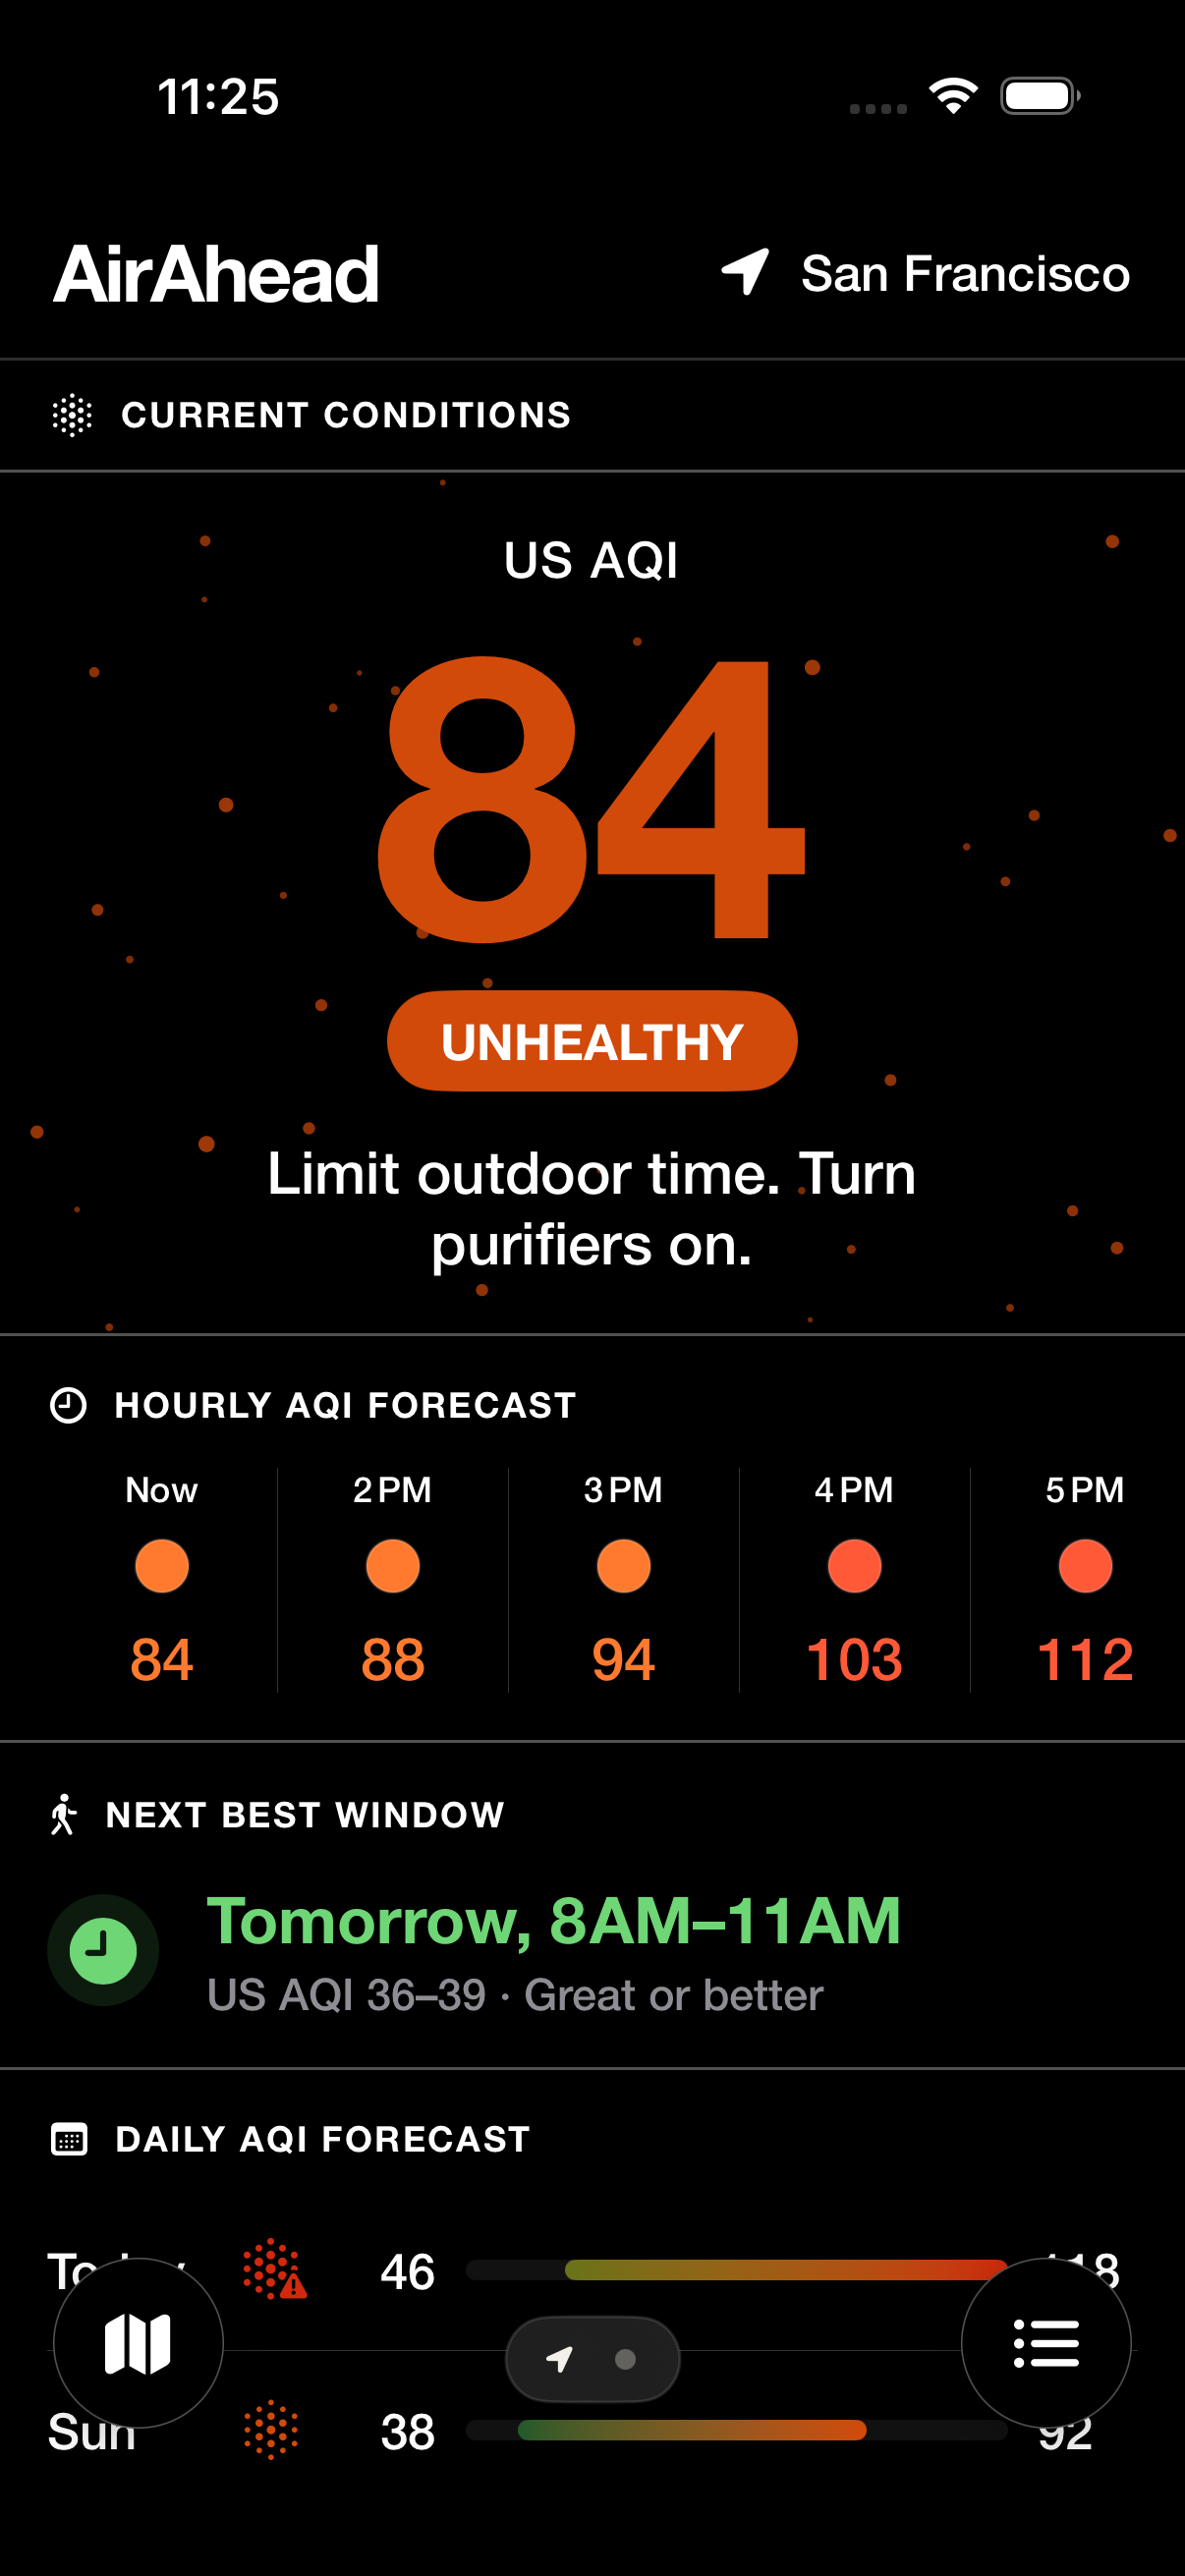
Why it matters
“Better air quality is the easiest way not to die”
AirAhead helps with the outdoor part: see current conditions, look ahead at the forecast, and plan time outside around better air.
See how AirAhead helpsPlan ahead
Check the four-day forecast at home or at your destination before changing your plans.
See the four-day forecastLook through the hourly forecast for the time you expect to be outside.
Explore the hourly forecastFind an upcoming window with better air quality.
Find your next best windowToday
Check the current Air Quality Index for your location, with a clear assessment of the conditions. The hourly forecast shows how air quality is expected to change through the day.
Save the places you check often, then move between their forecasts.
Limit outdoor time. Turn purifiers on.
Best window
AirAhead looks through the upcoming hourly forecast to find a suitable stretch of at least two hours outside. See the time range and expected AQI together, so you can decide when to walk, run, or head to the park.
Set your preferred hours so suggestions fit the part of the day that works for you. If no suitable window is forecast, the app tells you.
US AQI 34–39 · Great or better
Shaded hours are outside your preferred hours (6AM–9PM). Sample forecast.
Forecast
Compare the expected AQI range for the next four days. See which days are forecast to be clearer before making your plans.
Powered by Google’s air quality forecasting model, with hourly predictions up to four days ahead.
Pollutants
Go beyond the headline number. See which pollutant is driving the AQI, with concentration forecasts where available.
Plain-language notes explain the common sources and health effects of fine particles, ozone, nitrogen dioxide and more.
Smoke, vehicle exhaust, industrial emissions, and particles formed from gases in the air.
Can reach deep into the lungs and bloodstream, affecting lung and heart health.
Map
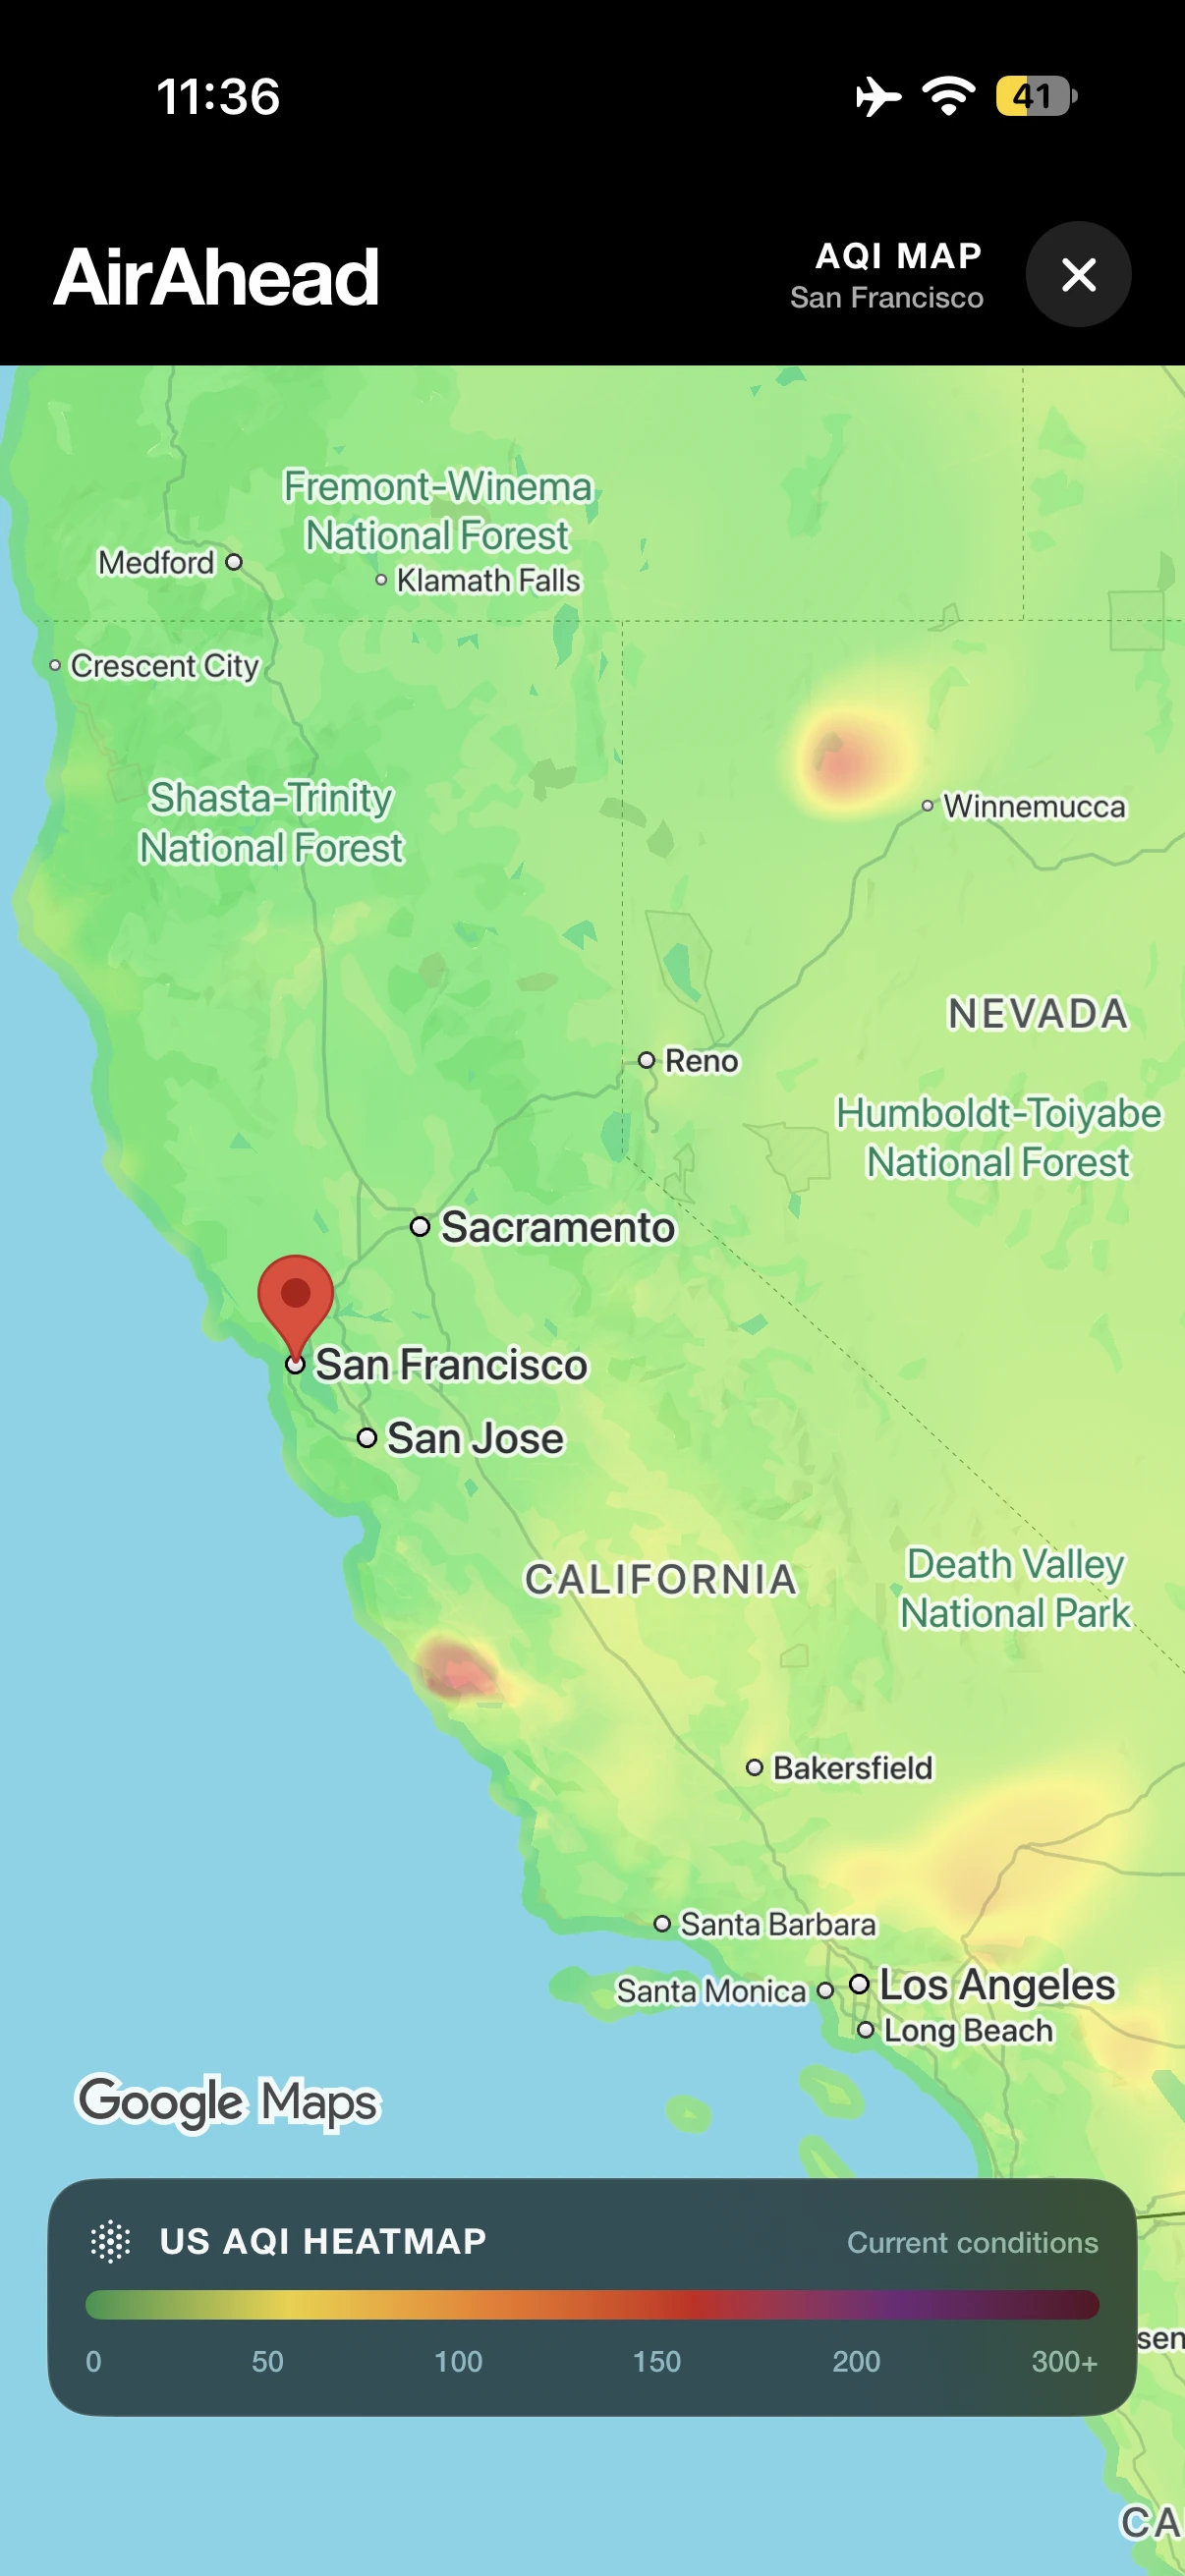
Explore the air quality heatmap to see how conditions vary across an area. Pan and zoom to compare nearby cities or take a look at your destination.
During smoke season, switch to fine particle, surface smoke and fire layers to follow where smoke is heading, with recent days and the forecast on one timeline.
Alerts
Choose alerts for each saved place: a daily brief at 7 AM, a heads-up when today may be Not great or worse, and an 8 PM warning when unhealthy air is forecast in the days ahead.
Alerts check the same forecast as the app, and each type arrives at most once a day per place.

Great until 11AM, then Very unhealthy by 4PM. Best window 8–11AM.
San Francisco may reach US AQI 112 (Very unhealthy) around 5PM.
Air in San Francisco may reach US AQI 118 (Very unhealthy) on Saturday.
Widgets
Add widgets for current air quality, upcoming forecasts, or your next best window. Choose a size and location to see the information you check most, without opening the app.
Widgets match the app in light and dark mode.
Apple Watch
See current conditions, your next best window, hourly and daily forecasts, and pollutants on Apple Watch.
Add a complication to keep the AQI on your watch face.
San Francisco
NEXT BEST WINDOW
Tomorrow, 8AM–11AM
US AQI 34–39 · Great
Our scale
AirAhead uses US AQI numbers everywhere, with its own plain-language assessments, so every number comes with a clear sense of what to do.
Private by design
Open the app and check the air. There’s nothing to sign up for.
AirAhead doesn’t show ads or track you across other apps.
Saved places and settings sync through your own iCloud account.
Sensitivity and allergen choices stay on your devices.
Questions
Current conditions and hourly forecasts up to four days ahead come from Google’s Air Quality API, which combines monitoring stations, satellite data, weather and emissions information in a forecast model. The map’s smoke, particle and fire layers come from NOAA, Copernicus CAMS and NASA.
Sensor maps show what individual monitors measured recently. AirAhead shows modeled air quality for the place you choose, including a forecast, so you can plan ahead. The number can differ from the nearest sensor, especially near a local source like a busy road or a fire.
Yes. Smoke raises fine particle (PM2.5) levels, which are included in the AQI and the forecast. The map also has surface smoke and satellite fire detection layers where those sources provide coverage.
Anywhere Google’s air quality model covers, in countries around the world. Coverage and forecast availability vary by location.
AirAhead is made for iPhone, iPad, Mac and Apple Watch, with an Android edition for Google Play.
The app rounds coordinates to about a one-kilometer area before asking for air quality, and there is no AirAhead account to link them to. Read the privacy policy for details.
No. AirAhead provides general information and is not a medical or emergency service. If you have a health condition, follow your care plan and local guidance.
Know the air quality where you are
and where you’re going.